News
NOAA Warns Record High CO2 Concentration: Global Warming Will Worsen Updated in October 2018
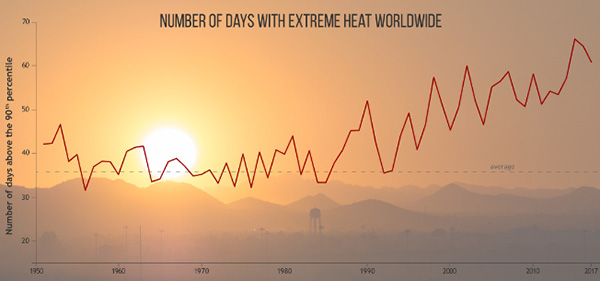
A report by NOAA (United States National Oceanic and Atmospheric Administration) announced that the average atmospheric concentration of carbon dioxide, the major cause of global warming, reached an all-time high in 2017. The report also points out that the temperature of land surface and sea level are both on the rise, indicating that global warming is actually worsening.
In the report titled “State of the Climate in 2017,” the average atmospheric concentration of CO2 was 205 ppm (1 part per million amounts to 1/1,000,000) in 2017. In comparison to the past 38 years, it was the highest. The average temperature of the earth’s surface for 2017, including both land and sea exceeded the annual average temperature data for 1981-2010 by 0.43 degrees Celsius. Moreover, the average for global sea level in 2017 was 7.7 centimeters higher than in 1993. The report mentions that the world’s sea level has risen by an average of 3.1 centimeters for every 10 years in the past.
The report also pointed out that the largest Arctic sea ice was 25 % smaller than the average figure obtained from past records, and that sea ice in Antarctica had shrunk to 2.1 million square kilometers. This is the lowest figure since 1978, when satellite data-collection first started. In 2017, the number of tropical cyclones totaled 85, exceeding the average figure of 82 from the periods during 1981-2010.
The Paris Agreement, an international framework to prevent global warming hauls a long-term goal to hold global average temperature increase to well below 2 degrees Celsius. To achieve this goal, we must suppress CO2 concentration on at average of 420 ppm worldwide.
In October 2016, WMO (World Meteorological Organization) announced that the average atmospheric concentration of CO2 in 2015 had reached a “hazardous” record-high level of 400 ppm. The NOAA report confirmed that the carbon dioxide concentration is definitely on the rise.