News
Last Year's CO2 Emissions to Increase from a Plateau According to IES Report Updated in May 2018
Last Year's CO2 Emissions to Increase from a Plateau According to IES Report
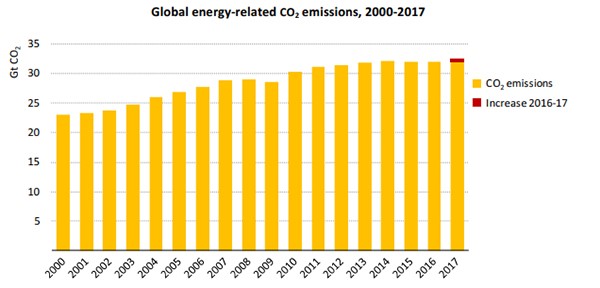
Carbon dioxide (CO2) emissions in 2017 increased 1.4 percent to 32.5 billion tons, according to a report released by the International Energy Agency (IEA). From 2014 to 2016, it had plateaued or remained flat, but the figure had turned upward for 2017. IEA says it is not sufficient to achieve the Paris Agreement goal, an international framework to prevent global warming.
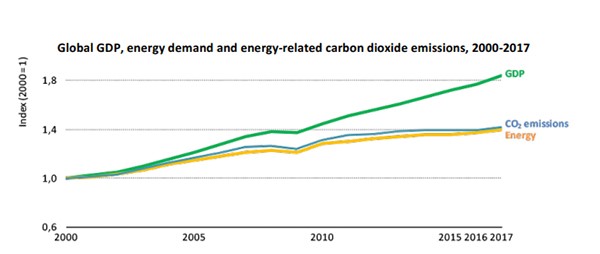
According to the report, the global energy demand in 2017 increased by 2.1 percent compared to last year. 72 percent of growth came from demands in fossil fuels. Especially in Asia, number of coal-fired thermal power plants, which emit more and more CO2, showed increase. Just by looking at electricity, it increased 3.1% compared to the previous year, and India and China accounted for 70% of this increase.
By energy source, increases in renewable energy, like solar and wind power stood out, accounting for 1/4 of growth in global energy demand. This figure reflected widespread use of renewable energy in China and the United States. Compared to the year before, the demand for petroleum increased 1.6% and the demand for coal increased 1%.
In addition, CO2 emission for 2017 had increased from 460 million tons to reach 32.5 billion tons. This number was the highest in history so far. IEA attributed this to an increase in energy demand due to growth in the global economy.
The Paris Agreement has set the goal for reducing global greenhouse gas emissions to zero by the second half of this century, with a temperature rise of no more than 2 degrees Celsius, or 1.5 degrees Celsius compared to the temperature before the industrial revolution. "The growth in energy-related carbon dioxide emissions in 2017 is a strong warning for global efforts to combat climate change, and demonstrates that current efforts are insufficient to meet the objectives of the Paris Agreement,” the IEA report points out.*
*Please see P.4 and the rest of the report for more details