


News
Global Average Temperature for 2017 was Second Highest Updated in March 2018
On January 18, World Meteorological Organization (WMO) announced that 2017’s global average temperature was the second highest in the history of climate observation. The year 2017 recorded the second highest temperature next to 2016. Counting back from the year 2015, temperature had stayed high for three consecutive years (2015-2017). The National Aeronautics and Space Administration (NASA) had also publicized last year's temperature data. WMO warns that “rise in the concentration of greenhouse gas clearly shows that climate change is continuing.”
WMO integrated and analyzed five observation data. As a result, the average temperature in the year 2017 was 14.8 degrees Celsius, which was 1.1 degrees higher than the pre-Industrial Revolution era in 19th century. It was in the same range as 2015. In 2016, the average temperature rose by 1.2 degrees to a record high figure. WMO points out that the year 2016 was strongly influenced by El Niño. However, El Niño did not occur in 2017. Therefore, the temperature for 2017 was “the hottest so far without El Niño factors.”
On the same day, NASA also announced that the average global temperature for 2017 was 0.9 degrees higher than the average figure during 1951-1980.
About the global temperature data of 2017, WMO Secretary-General Taalas comments that “The long-term temperature trend is far more important than the ranking of individual years, and that trend is an upward one.” The international framework to prevent global warming, the Paris Agreement aims to substantially reduce greenhouse gas emissions to zero in the second half of this century and aims to keep the rise in temperature below 2 degrees, preferably 1.5 degrees, to a level prior to the industrial revolution. Publicized data show that global warming has already exceeded more than half of the initial target.
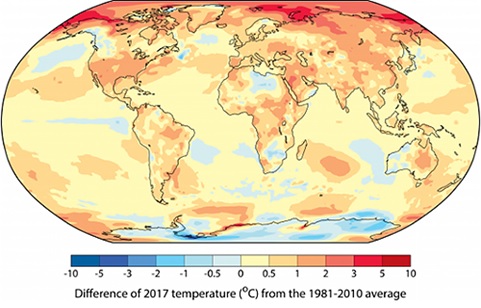
(Provided by WMO)
Photos courtesy of Japan Science and Technology Agency
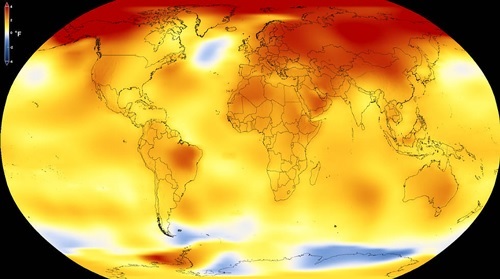
(Provided by NASA)
Photos courtesy of Japan Science and Technology Agency